S&P100 Weekly Portfolio w/e Nov 20th
- Send an email to wallandbroad.com@gmail.com for a complimentary copy of our weekly newsletter.
- New 1st time frame up trend.
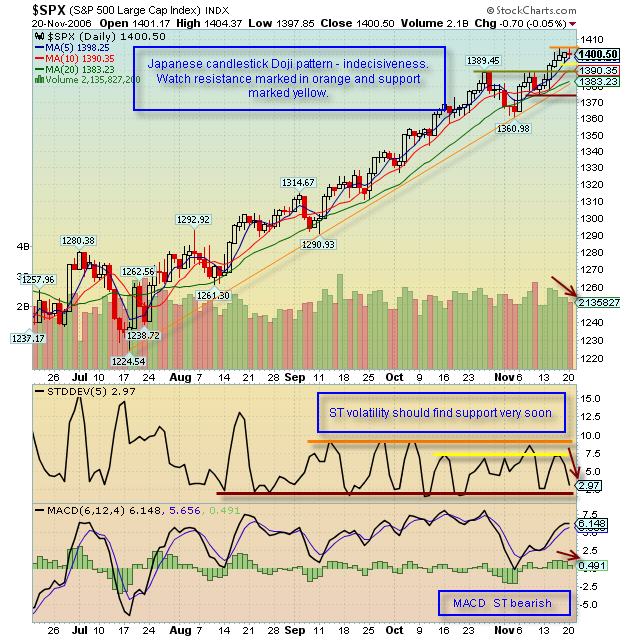
- Japanese candlestick Doji pattern - indecisiveness.
- The market closed with neither the bulls nor bears keen or in control and both sides lost the commitment they had during the day.
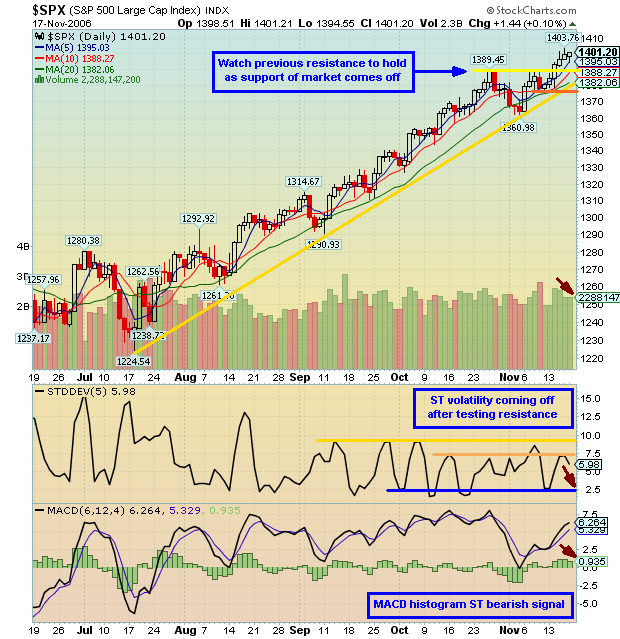
- There was downside price rejection from the resistance area, marked in orange on the chart. There is potential support just below the day's low at the area marked in yellow. The previous resistance area, marked in dark yellow, should be watched as another potential support area.
- Triple MAs remain BULLISH.
- MACD histogram remains ST bearish.
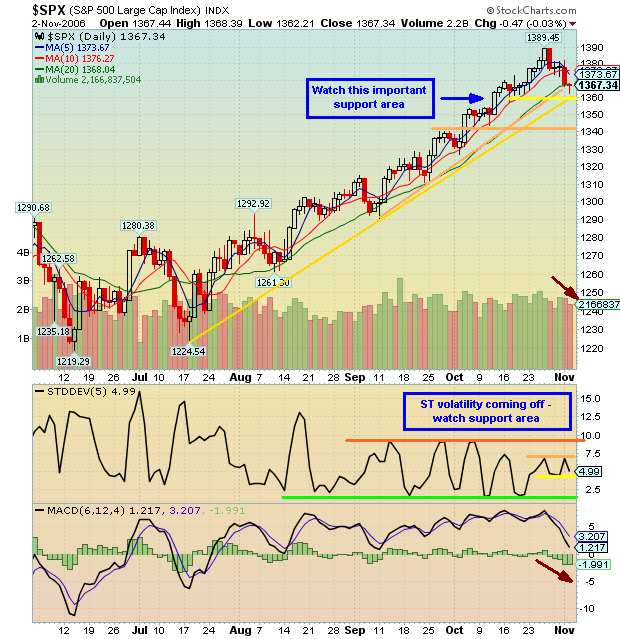
- ST volatility continues to trend down and would be expected to find support over the next few days. ST volatility will then begin to trend up - potential trending action. So, expect a breakout in either direction within the next few days. Therefore, stops should be tightened by those who are long.
- Volume continues to come off as the market attempted to take out the previous peak - bearish. This reflects the slight lack of power of the bulls in this attempt at swing highs.
posted by Equities Analyst at 6:07 PM
![]()
![]()