Market news, views and information from a Wall Street veteran

Friday, September 29, 2006

Dow 30 stocks - Daily Outperforming and Underperforming

Bullish ST
AXP, BA, DIS, GE, GM, HON, INTC, MCD, MSFT, WMT

Bearish ST
MO

S&P500 Daily Analysis


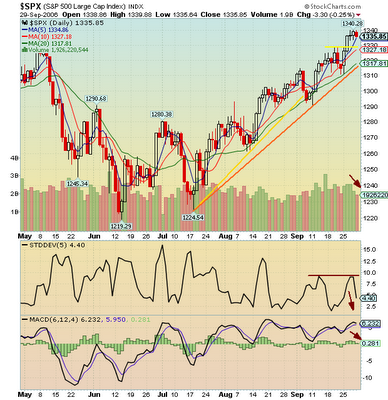
  • Inside day - denotes indecision.
  • Bears closed the day in control but not committed enough to take out yesterday's low.
  • Triple MAs remain BULLISH.
  • MACD histogram has turned down - ST pullback likely.
  • ST volatility trending down - consolidation or ST pullback.
  • Volume coming off as bulls lose intensity - profit-taking ? Will this become another setup to eventually get long ?
  • If pullback occurs, watch previous resistance area around 1328 (marked in yellow on chart) to act as support.

Thursday, September 28, 2006

Dow 30 stocks - Daily Outperforming and Underperforming

Bullish ST
AXP, BA, DD, GE, HON, INTC, MCD, MSFT, WMT

Bearish ST
MO

S&P500 Daily Analysis


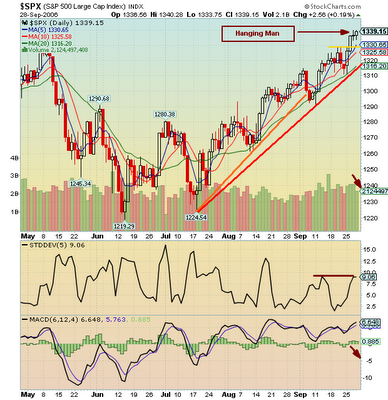
  • Japanese Candlestick Hanging Man reversal pattern - potential ST pullback BUT confirmation required.
  • Triple MAs remain BULLISH.
  • MACD histogram has turned down - ST pullback likely.
  • ST volatility has halted at resistance - consolidation or ST pullback unless resistance can be taken out.
  • Volume has come off as high made - bulls lacking conviction - ST pullback a possibility.
  • If pullback occurs, watch previous resistance area around 1328 (marked in yellow on chart) to act as support.

Wednesday, September 27, 2006

Dow 30 stocks - Daily Outperforming and Underperforming

Bullish ST
AIG, AXP, BA, GE, HON, INTC, MCD, MMM, MRK, MSFT, PG, WMT,

Bearish ST
HPQ, MO,

S&P500 Daily Analysis


  • Market closed indecisively.
  • Prospective Japanese candlestick reversal pattern - Spinning Top or Doji - denotes indecisiveness but NEEDS confirmation.
  • Triple MAs remain BULLISH
  • MACD histogram remains BULLISH
  • ST volatility trending up BUT has halted at resistance area marked on the chart.
  • Volume failed to move higher with the swing - NEUTRAL.
  • Possible short-term pullback ahead.

Dow 30 stocks - Daily Outperforming and Underperforming

Bullish ST
AXP, BA, DD, DIS, GE, HON, MCD, MMM, T, VZ, WMT

Bearish ST
MO

Tuesday, September 26, 2006

S&P500 Daily Analysis


  • Another bullish day.
  • Important resistance area taken out.
  • Next signiifcant resistance around 1380 region - nice potential for this current move.
  • Triple MAs remain BULLISH
  • MACD histogram is BULLISH
  • ST volatility trending up, so it looks like the current swing should develop further, at least until the ST volatility hits the resistance area marked on the chart.
  • Volume is appreciating with the swing - BULLISH.

Monday, September 25, 2006

S&P500 Daily Analysis


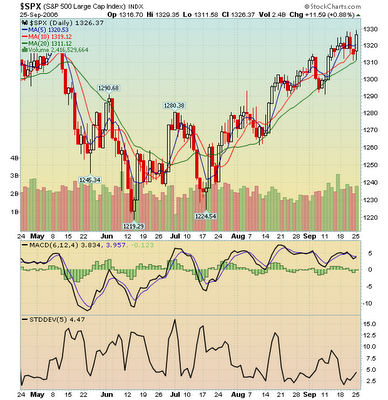
  • An extremely bullish day with some price rejection from previous highs.
  • Triple moving averages remains bullish.
  • MACD histogram BUY signal.
  • Short term volatility trending up from a base - expect to see more ST trending action.
  • Will this market take out the important resistance level tomorrow ? Let's see. This market seems to have enough momentum to do so but will it be sustained ?

S&P500 Weekly Analysis

Weekly

The weekly Cycle Gauge is B5. This indicates that the market has been in the Advancing Phase for five weeks.

  • 54% (73% prev) of stocks closed above their 4 week MA - ST BEARISH.
  • 61% (63% prev) of stocks closed above their 30 week MA - MT BULLISH.
BULLISH SECTORS
  • Consumer Non-Durables
  • Drugs
  • Insurance
  • Real Estate
  • Media
  • Computer Software and Services
BEARISH SECTORS
  • Energy
  • Metals and Mining
  • Transportation
Disclaimer
Terms and Conditions of Use

The information contained in this publication has been prepared with all reasonable care from sources, which we believe are reliable. The author accepts no responsibility or liability for any errors or omissions or misstatements however caused. Under no circumstances and in no event shall the author of this site liable for direct, indirect, or incidental damages resulting from the use of the information. The author of this site may have positions in securities mentioned herein. Any opinions, forecasts or recommendations reflect our judgement and assumptions at the date of publication and may change without notice. This publication is not and should not be construed as an offer to sell or the solicitation of an offer to purchase or subscribe for any investment. We are not aware that any recipient intends to rely on this publication or of the manner in which the recipient intends to use it. In issuing this publication it is not possible to take into account the investment objectives, financial situation or particular needs of any recipient. Investors should obtain financial advice to determine whether recommendations in this publication are appropriate to their investment objectives, financial situation or particular needs before acting on such recommendations. The author may from time to time hold positions in any securities included on this site and may buy or sell such securities or engage in other transactions involving such securities.

Locations of visitors to this page