Market news, views and information from a Wall Street veteran

Saturday, December 30, 2006

Wall-and-Broad.com newsletter for Dec 29th released

The latest issue of the Wall-and-Broad.com newsletter is NOW AVAILABLE !

The weekly Wall-and-Broad,com newsletter contains the weekly analysis of the S&P500 index , the major sector weightings and our S&P100 portfolio, including the current week's entries.

The current week's entries are ONLY available in the newsletter, NOT on the postings on this site. So, you MUST be a subscriber to get in early on the new portfolio entries.

Take advantage of the one week free trial subscription to the newsletter.

It's easy to subscribe - just send an email containing your name and city to wallandbroad.com@gmail.com and I will send a FREE 1 WEEK TRIAL SUBSCRIPTION.

Remember, the newsletter contains a weekly analysis of the S&P500 index, a guide to the relative over or under performance of the major sectors of the market AND my model stock portfolio based on S&P100 stocks.

Subscription to the Wall-and-Broad.com weekly newletter is ONLY US$20 per month.

I have a special offer to first time subscribers who can receive the 1st month's subscription (following the free 1 week subscription) for ONLY US$10.

You will be pleasantly surprised when you see the value of this subscription.

Take advantage of this low cost US$20 subscription by sending an email to wallandbroad.com@gmail.com.

Tuesday, December 26, 2006

S&P100 Weekly Portfolio w/e Dec 22nd

This week's new entries are in the current issue of the weekly newsletter.

For a FREE copy of our weekly NEWSLETTER send an email to wallandbroad.com@gmail.com

Ticker Name Close BuyPrice BoughtWeeksAgo PctP/L
TWX Time Warner Inc 22.08 17.73 13 24.53
GS Goldman Sachs Group Inc 198.09 162.71 14 21.74
CMCSA Comcast Corp Cl A 42.43 35.12 13 20.81
ATI Allegheny Technologies 89.13 74.26 10 20.02
UIS Unisys Corp 7.6 6.88 6 10.47
ETR Entergy Corp 92.8 85.3 9 8.79
CI Cigna Corp 130.35 121.49 5 7.29
WY Weyerhaeuser Co 70.26 66.68 2 5.37
RTN Raytheon Co 53.43 51.3 3 4.15
MCD Mcdonalds Corp 43.57 42.08 3 3.54
AXP American Express Co 60.85 58.86 6 3.38
DIS Walt Disney Co The 34.16 33.09 3 3.23
EMC Emc Corp 13.42 13.08 4 2.6
USB US Bancorp 36.65 35.79 1 2.4
MS Morgan Stanley 79.7 78.61 2 1.39
C Citigroup 54.55 54.07 1 0.89
CBS CBS Corp Class B 31.19 30.93 2 0.84
T AT&T Inc 34.98 34.97 2 0.03
IBM International Business Machines Corp 95.25 95.3 1 -0.05
HD Home Depot Inc 38.89 38.97 3 -0.21
OMX Officemax Inc 50.11 50.92 1 -1.59
CVX Chevron Corp 72.73 75.38 1 -3.52
DELL Dell Inc 25.45 27.33 4 -6.88

Thursday, December 21, 2006

S&P500 Daily Analysis for Dec 21st


  • Send an email to wallandbroad.com@gmail.com for a complimentary copy of our weekly newsletter.
  • New 1st time frame down trend.
  • The market closed with the bears keen, showing some commitment and having moderate control.
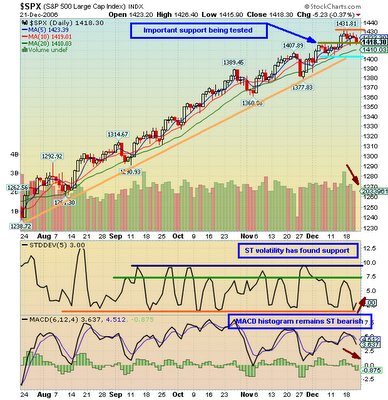
  • The previous resistance area, marked in dark yellow, which has acted as support was tested once again yesterday. This level will be very important to the market over the next few days. Should it be broken, the support area, marked in light blue, around 1400, will come into play.
  • Triple MAs are NEUTRAL.
  • MACD histogram remains ST bearish.
  • ST volatility has found support. We should continue to see volatility pick up following this cyclical bottom. That means, we should see ST trending action. This makes the current support level very important. If it is taken out to the down side, we should see 1400 tested. If the support holds, the market will retest the resistance area marked in orange.
  • Volume continues to come off as the market consolidates - still nothing unusual.

Wednesday, December 20, 2006

S&P500 Daily Analysis for Dec 20th


  • Send an email to wallandbroad.com@gmail.com for a complimentary copy of our weekly newsletter.
  • New 1st time frame up trend.
  • The market closed with the bears keen and in control. The bulls showed some promise by taking out yesterday's high but lacked the commitment to close the market near there.
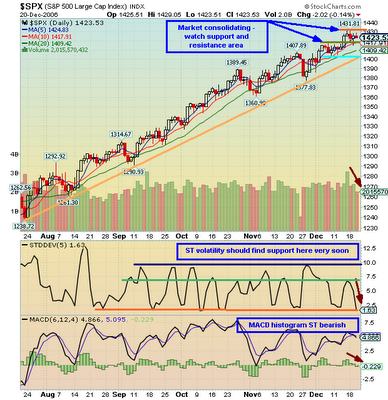
  • Once again we saw downside price rejection from the resistance area, marked in orange on the chart. The previous resistance area, marked in dark yellow, acted as support yesterday and should be watched closely again.
  • Triple MAs remain BULLISH.
  • MACD histogram remains ST bearish.
  • ST volatility should find support very soon. We are looking for a cyclical bottom in volatility within the next few days. This means that we should see some ST trending action. This makes any approach to the support or resistance areas of particular importance.
  • Volume continues to come off as the market consolidates - still nothing unusual.

Monday, December 18, 2006

Weekly Sector Strength for w/e Dec 15th

For a FREE copy of our weekly NEWSLETTER send an email to wallandbroad.com@gmail.com


Name WEIGHTING
-Chemicals- OVERWEIGHT
-Energy- NEUTRAL
-Metals & Mining- NEUTRAL
-Conglomerates- NEUTRAL
-Consumer Durables- NEUTRAL
-Consumer Non-Durables- NEUTRAL
-Automotive- NEUTRAL
-Food & Beverage- NEUTRAL
-Tobacco- NEUTRAL
-Banking- NEUTRAL
-Financial Services- NEUTRAL
-Insurance- OVERWEIGHT
-Real Estate- OVERWEIGHT
-Drugs- NEUTRAL
-Health Services- NEUTRAL
-Aerospace/Defense- NEUTRAL
-Manufacturing- NEUTRAL
-Materials & Construction- OVERWEIGHT
-Leisure- OVERWEIGHT
-Media- OVERWEIGHT
-Retail- NEUTRAL
-Specialty Retail- NEUTRAL
-Wholesale- NEUTRAL
-Diversified Services- OVERWEIGHT
-Transportation- NEUTRAL
-Computer Hardware- OVERWEIGHT
-Computer Software & Services- NEUTRAL
-Electronics- NEUTRAL
-Telecommunications- OVERWEIGHT
-Internet- OVERWEIGHT
-Utilities- OVERWEIGHT

S&P100 Weekly Portfolio w/e Dec 15th

For a FREE copy of our weekly NEWSLETTER send an email to wallandbroad.com@gmail.com

Ticker Name Close BuyPrice BoughtWeeksAgo PctP/L
GS Goldman Sachs Group Inc 199.84 162.71 13 22.82
CMCSA Comcast Corp Cl A 42.95 35.12 12 22.29
TWX Time Warner Inc 21.66 17.73 12 22.17
ATI Allegheny Technologies 88.47 74.26 9 19.14
ETR Entergy Corp 92.6 85.3 8 8.56
UIS Unisys Corp 7.45 6.88 5 8.28
WY Weyerhaeuser Co 71.93 66.68 1 7.87
CI Cigna Corp 129.65 121.49 4 6.72
AXP American Express Co 61.64 58.86 5 4.72
XOM Exxon Mobil Corporation 77.3 74.42 5 3.87
DIS Walt Disney Co The 34.3 33.09 2 3.66
AIG American Internat Group 72.13 69.63 5 3.59
CBS CBS Corp Class B 31.99 30.93 1 3.43
MCD Mcdonalds Corp 43.41 42.08 2 3.16
EMC Emc Corp 13.46 13.08 3 2.91
RTN Raytheon Co 52.66 51.3 2 2.65
HD Home Depot Inc 39.89 38.97 2 2.36
T AT&T Inc 35.66 34.97 1 1.97
BA Boeing Co 90.7 89.77 3 1.04
MS Morgan Stanley 79.26 78.61 1 0.83
IBM International Business Machines Corp 95.3 95.3 0 0
C Citigroup 54.07 54.07 0 0
OMX Officemax Inc 50.92 50.92 0 0
CVX Chevron Corp 75.38 75.38 0 0
USB US Bancorp 35.79 35.79 0 0
DELL Dell Inc 26.53 27.33 3 -2.93

S&P500 Daily Analysis for Dec 18th


  • Hello everyone, back from my Hawaii vacation.
  • Send an email to wallandbroad.com@gmail.com for a complimentary copy of our weekly newsletter.
  • New 1st time frame down trend.
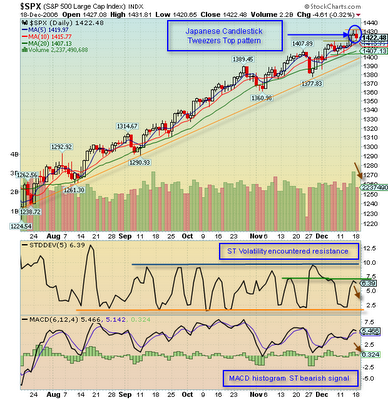
  • Japanese candlestick Tweezers Top pattern - potential ST correction.
  • Latest candle is also a Japanese Candlestick Spinning Top pattern - indecision.
  • The market closed with the bears keen and having some moderate level of control and commitment.
  • There was downside price rejection from the resistance area, marked in orange on the chart. The previous resistance area, marked in dark yellow, should be watched as a potential area of support.
  • Triple MAs remain BULLISH.
  • MACD histogram has given a ST bearish signal.
  • ST volatility has turned down form a fairly strong area of resistance. It is most likely that we should see price consolidation or a ST pullback.
  • Volume came off as the market pulled back from the swing high - nothing unusual here.
Disclaimer
Terms and Conditions of Use

The information contained in this publication has been prepared with all reasonable care from sources, which we believe are reliable. The author accepts no responsibility or liability for any errors or omissions or misstatements however caused. Under no circumstances and in no event shall the author of this site liable for direct, indirect, or incidental damages resulting from the use of the information. The author of this site may have positions in securities mentioned herein. Any opinions, forecasts or recommendations reflect our judgement and assumptions at the date of publication and may change without notice. This publication is not and should not be construed as an offer to sell or the solicitation of an offer to purchase or subscribe for any investment. We are not aware that any recipient intends to rely on this publication or of the manner in which the recipient intends to use it. In issuing this publication it is not possible to take into account the investment objectives, financial situation or particular needs of any recipient. Investors should obtain financial advice to determine whether recommendations in this publication are appropriate to their investment objectives, financial situation or particular needs before acting on such recommendations. The author may from time to time hold positions in any securities included on this site and may buy or sell such securities or engage in other transactions involving such securities.

Locations of visitors to this page