S&P500 Daily Analysis for Oct 31st
- Send an email to wallandbroad.com@gmail.com for a complimentary copy of our weekly newsletter.
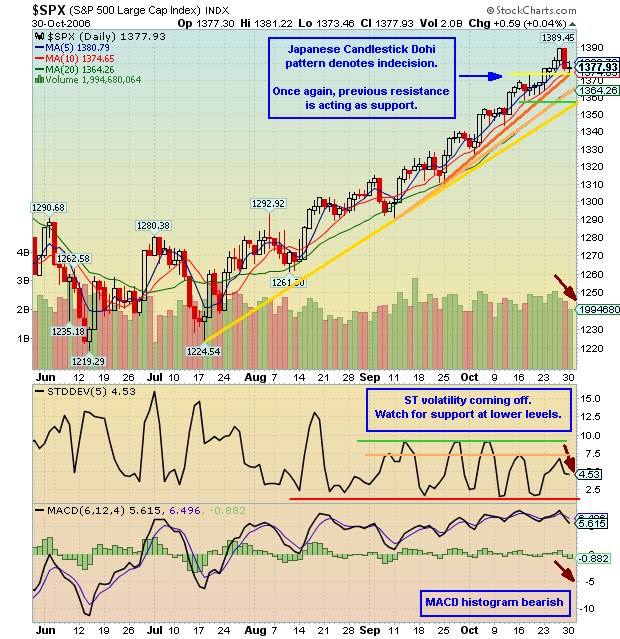
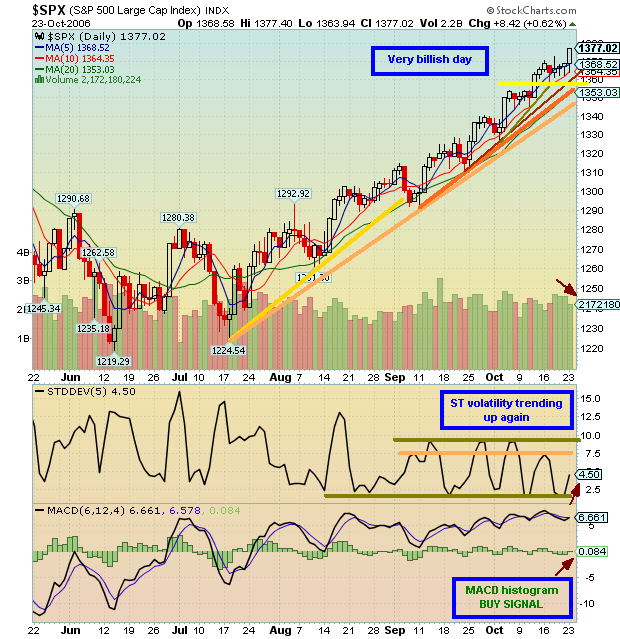
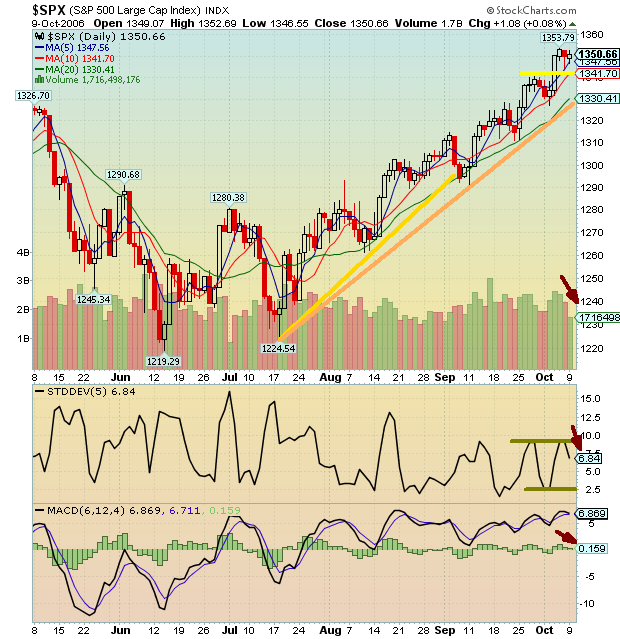
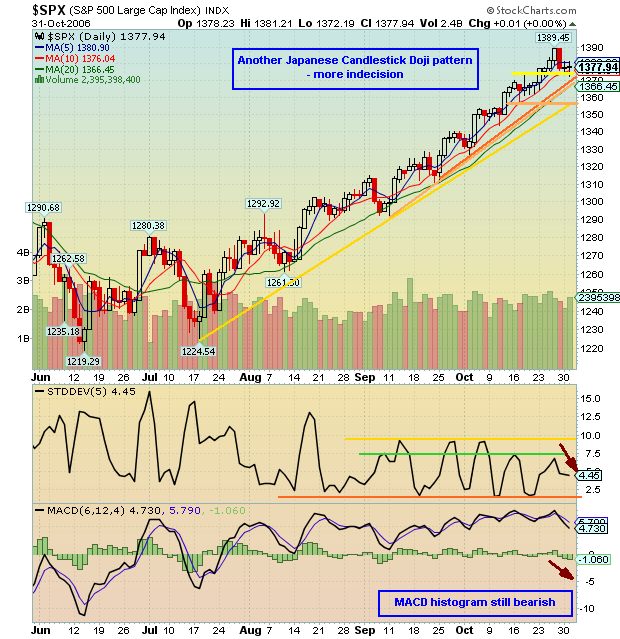
- 1st time frame down trend remains intact.
- Another Japanese Candlestick Doji pattern denotes indecision - this down swing doesn't look too healthy, does it ?
- The market closed with neither bulls nor bears in control. The bears lacked the the commitment to close the market down near the lows but the bulls also lacked commitment.
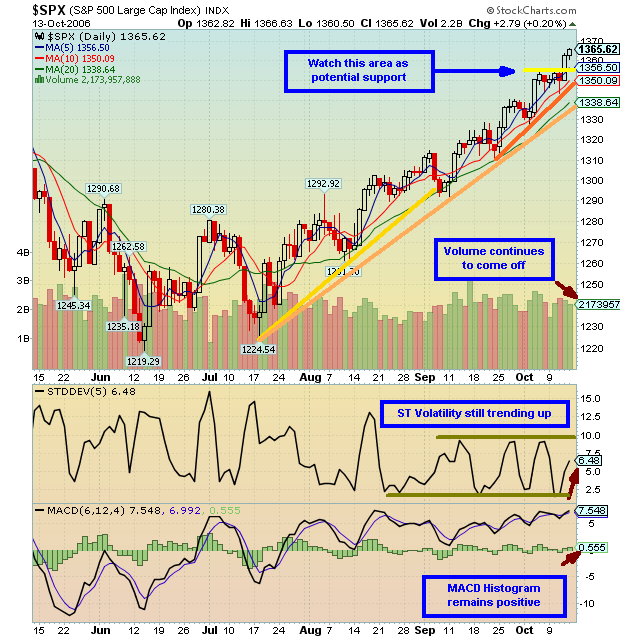
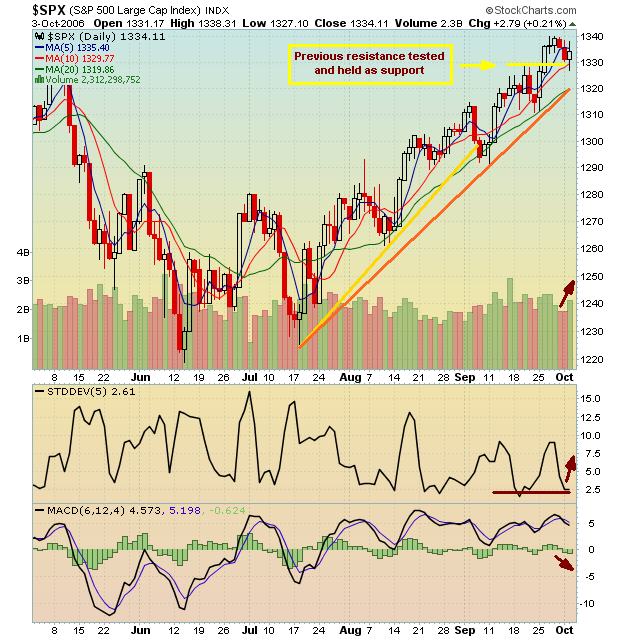
- Once AGAIN, the former resistance area, marked in yellow, held as support yesterday. This continues to build as a significant area and should be watched very closely tomorrow. The support area, marked in green, below it, should also be watched.
- Triple MAs remain BULLISH.
- MACD histogram remains bearish.
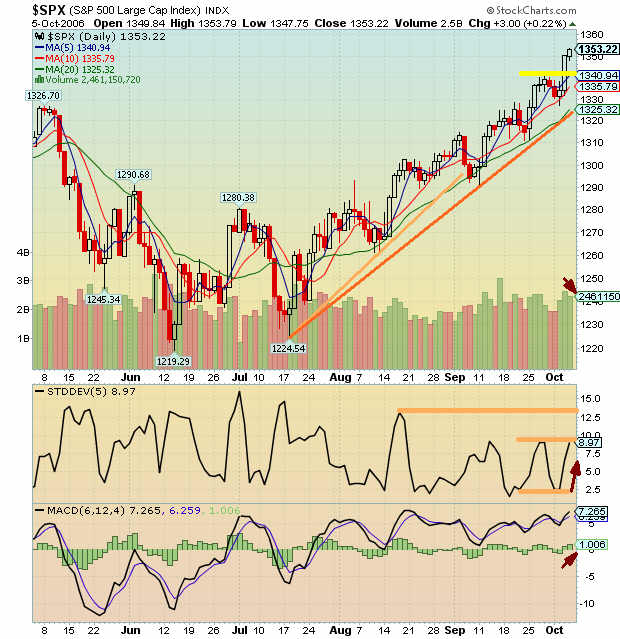
- ST volatility has turned down having re-tested the resistance level marked in orange. This reflects the current ST consolidation happening in this market.
posted by Equities Analyst at 9:08 PM
![]()
![]()